
* 722% gain since 2007* ...
* 67.2% average annual returns ...
* During a period that includes the worst bear market of our lifetime.
The following charts give you a snapshot view of what you could have achieved with the Weiss Ultimate Portfolio from four different perspectives.
They compare three hypothetical investors, beginning with $25,000 each on January 1, 2007:
The first investor buys the S&P 500 index; the second buys the same investments as Warren Buffett’s Berkshire Hathaway; and the third follows the Weiss Ultimate Portfolio.
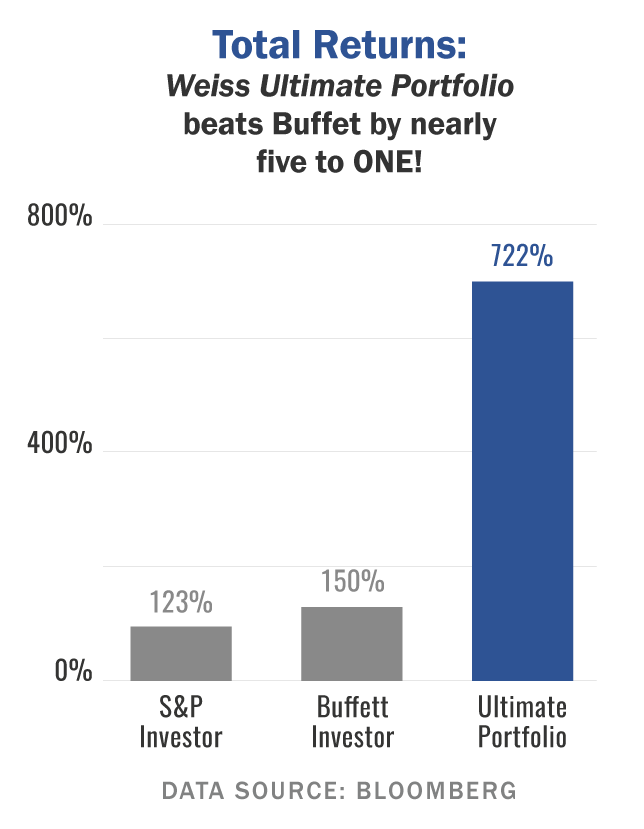
As you can see, with the Weiss Ultimate Portfolio the total return for the period, which includes the Great Recession, is 722%.
By contrast, the Buffett investor makes a total return of 150%, and the S&P investor achieves a return of 123.6%.
These are not bad returns. But they pale in comparison to what you could have achieved with our strategy.
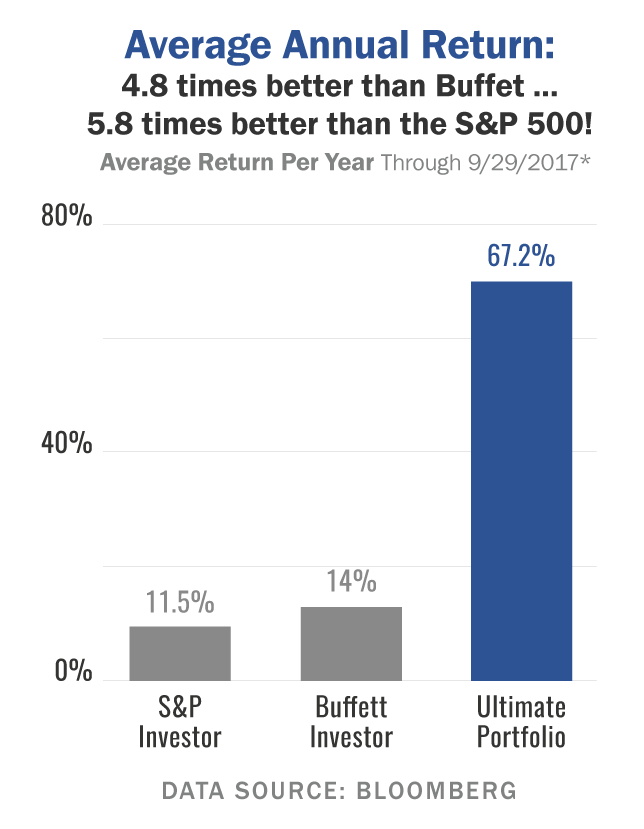
This second chart makes a similar comparison, but in terms of average total returns per year:
The S&P investor could have made 11.5% per year; the Buffett Investor, 14%; and the Ultimate Portfolio investor 67.2% per year.
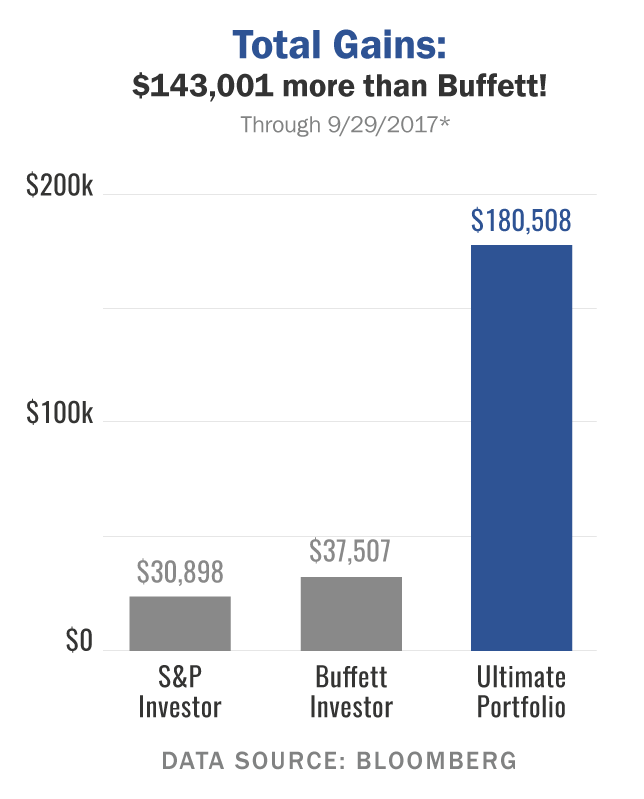
The third chart expresses the total returns for the same period in dollars.
As you can see, the S&P investor ends the period with a gain of $30,898; the Buffett investor ends the period with a gain of $37,507; and the Ultimate Portfolio, with a gain of $180,508.
These are very substantial differences: The Ultimate Portfolio investor makes $143,001 more than the Buffett investor and $149,610 more than the S&P investor.
The last chart, below, is about relative outperformance, asking the question: How many times more could investors following the Weiss Ultimate Portfolio have made, compared to investors in five other investments or indexes?
Comparative Performance (Jan. 1, 2007 - Sep. 30, 2017)
| Investment | Outperformance | |
|---|---|---|
| Weiss Ultimate Portfolio beats | Nasdaq Composite | 4.3 to one |
| Weiss Ultimate Portfolio beats | Berkshire Hathaway | 4.8 to one |
| Weiss Ultimate Portfolio beats | S&P 500 Index | 5.8 to one |
| Weiss Ultimate Portfolio beats | Dow Jones Industrials | 9.1 to one |
The chart shows how investors following the Weiss Ultimate Portfolio could have beaten the Nasdaq Composite Index by 4.3 to 1 …
Outperformed Warren Buffett’s Berkshire Hathaway shares by 4.8 to one.
Outperformed the S&P by 5.8 to one, and …
Beaten the Dow Jones Industrials by a whopping 9.1 to 1!
By always selecting only investments representing the ultimate in quality in the world, the Weiss Ultimate Portfolio shows consistently large outperformance compared to a wide variety of investments.
Home Track Record Benefits Join Now Legacy FAQs Reviews Editor Videos
* For fair comparison, the performance of all investments is calculated on an equivalent basis. It represents each investment's total compound returns (price appreciation plus dividends) before taxes and broker commissions. The Ultimate Portfolio uses the same measure, depicting what a hypothetical investor could have achieved if he had followed our new model during the same period. For details, see Terms and Conditions. Data Sources: Bloomberg, Weiss Ratings.